Cepheid Pulsation: An Idealized Thought Experiment
Compiled by Grady Owens
Based on a problem presented in An Introduction to Modern Astrophysics (Second Edition), by Bradley W. Carroll and Dale A. Ostlie, 2007
|
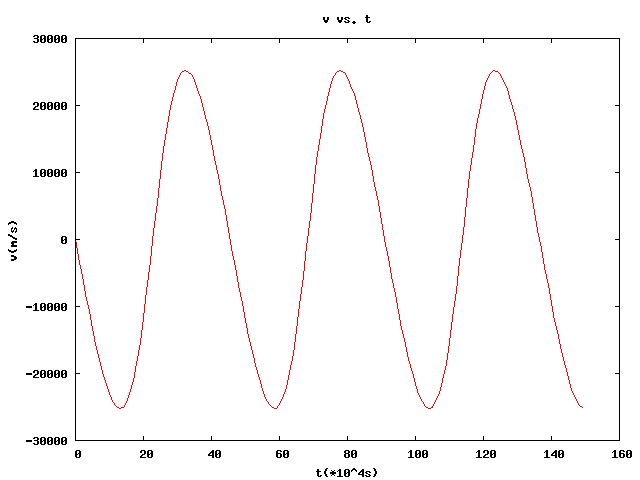
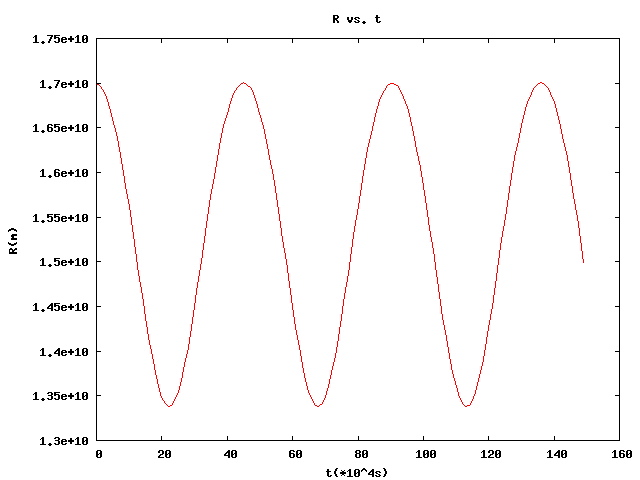
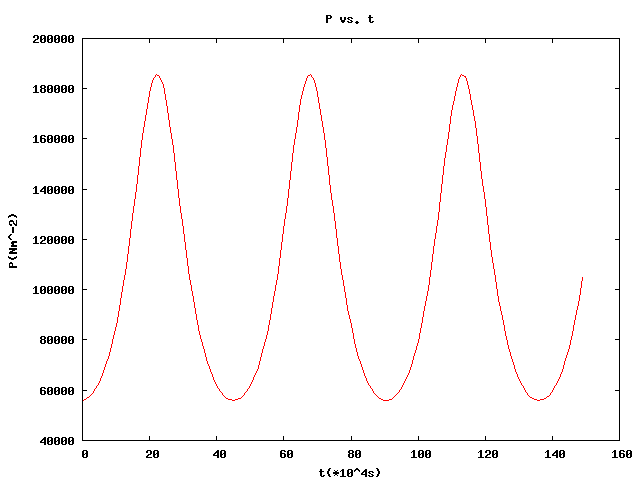
For this experiment, consider a highly unrealistic model of a pulsating star consisting of a central point mass equal to the entire mass of the star, M, surrounded by a single thin spherical shell of mass m and radius R that represents the surface layer of the star. Within this shell is a massless gas of pressure P that supports the shell against the gravitational pull of the central mass. Newton's second law applied to the forces on the shell yields mdv/dt = -GMm/R^2 + 4πR2P The left-hand side of this equation represents the total force on the system, or the equilibrium state; the right side sums the force upon the gas shell due to the gravitational influence of the central mass and the shell's own mass, and the force upon the shell's internal surface area applied by the internal massless gas. Assuming the expansion and contraction of the gas are adiabatic and using the definition of velocity, it is possible to find the velocity of the outer shell, its radius, and the pressure of the inner massless gas after an interval of time Δt given the central point mass M and the mass of the gas shell m. In this example, we are going to assume that M = 1 × 1031 kg and that m = 1 × 1026 kg; the first value is typical of the mass of a classical Cepheid variable star, and the second value is arbitrarily assigned. Given values Ri = 1.7 × 10¹⁰ m using a time interval of Δt of 104 s, it is possible to show that the system visibly pulsates, as seen in Figures 1 through 3.
Using the values for the radius R, it is possible to visibly demonstrate what this pulsation actually looks like; this is done in Figure 4.
Using Figure 2 as a reference, we can see that R0, the radial equilibrium value, is about 1.52 × 10¹⁰ m; using this, we can calculate that the period of this oscillation is roughly 5.28 days. The period for this oscillation is observed in δ Cephei to be roughly 5.37 days. Considering the highly idealized nature of this experiment, the obtained value for this is remarkable, and tells us something of the inner workings of the Cepheid class of variable stars. |